5 Chart Patterns to Check when Trading Gold
Asset prices move up and down within trends. Those trends usually take place within a bigger, longer term trend. One thing that is certain is that trends, up or down, always end. Traders will look to buy as a bear trend turns bullish, and sell when a bull trend turns bearish. Spotting the turning point of a trend, or the high and low points of a trading pattern, enables the trader to pick his buy and sell points.
Charts are seen as a good way to spot reversals, and traders often use them as indicators of buy and sell opportunities.
There are five basic reversal patterns that are easily identifiable, though each has a buy signal and a sell signal. Each can be used by the experienced chartist, who will also consider time and volume as well as price to decide if the signal is strong.
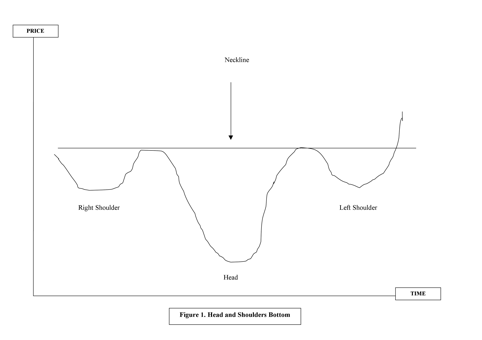
Head and Shoulders Bottom (Figure 1) – Buy Signal
In this very often reliable reversal pattern, the signal to buy is given when the neckline is broken through in the final rally in the cycle.
The Right Shoulder
At the end of a prolonged fall in the gold price, and where trade has been high, the right shoulder will be formed. As trade volume drops, the shoulder rounds, the neckline starts and the head forms.
The Head
With volume falling, and the gold price dropping, the pattern reverses as volume picks up and the price begins to climb. The gold price will rise close to the level of the right shoulder.
The Left Shoulder
This is forms as the price falls to around the level of the right shoulder. Trading volume is usually higher than that seen with the fall in the right shoulder, and also the fall that shaped the head.
The neckline can be drawn across the tops formed by the point at which the shoulders meet to form the head. Once the gold price rises from the left shoulder and breaks up through the neckline, the buy signal is triggered.
The head and shoulders pattern doesn’t need to be symmetrical, and the neckline might slope slightly up or down.
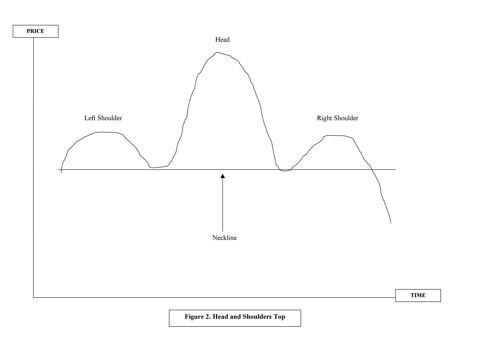
Head and Shoulders Top (Figure 2) –Sell Signal
The opposite of the head and shoulders bottom, this is a signal of an end to an up-trend.
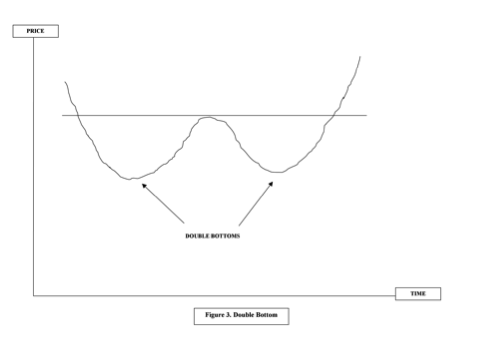
Double Bottom (Figure 3)
With a double bottom, a trough is reached before a small rally, which is then followed by a further price fall to a new trough at about the same level as the first. From this second trough, the price of gold starts to rally again, finally moving up through the level of the mid-point high, and a new up-trend is signalled.
This pattern could be part of a longer term downtrend, and so care should be taken with this reversal signal: the longer the time between the two bottoms – and the deeper the troughs – the more certain a reversal is. There’s also likely to be higher volume in the last leg of this pattern.
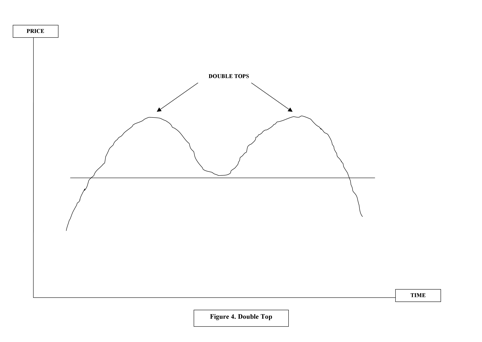
The opposite of a double bottom is, of course, the Double Top (Figure 4).
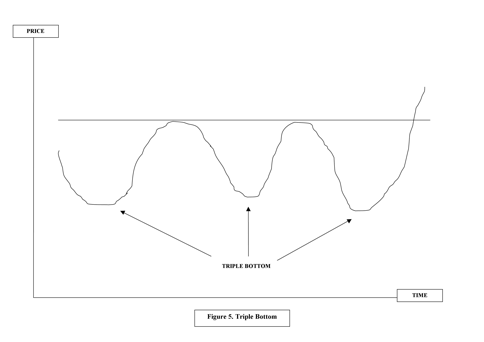
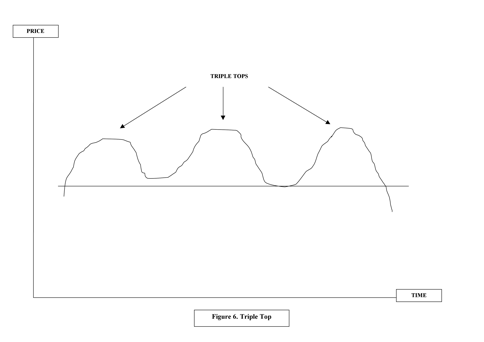
Triple Bottom (Figure 5) and Triple Top (Figure 6)
The triple bottom and triple top reversal patterns are less common than double tops and bottoms, but once more are marked by increasing volumes of gold traded. Peaks and troughs can be of differing sizes, and may be unequally spaced over time.
Triple tops and bottoms are confirmed when the price of gold rises through the higher of the two peaks (triple bottom) or the lower of the two troughs (triple top).
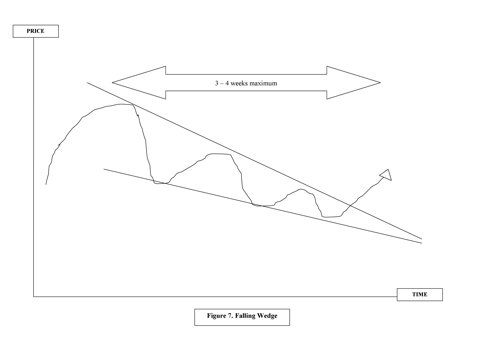
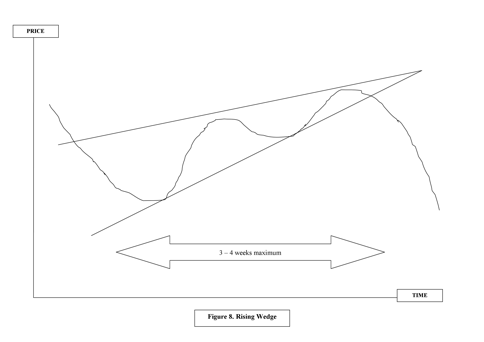
Falling Wedge (Figure 7) and Rising Wedge (Figure 8)
Sometimes trend lines through peaks and troughs run parallel to each other. At other times they widen, and sometimes they will narrow. When they narrow and converge, they are called wedges.
When the wedge points down, as it does in figure 7, then a rise in the gold price is to be expected after the price breaks up through the upper line of the wedge. This is usually a reversal of a minor trend within a longer term trend. So the wedge is normally formed through no more than 4 weeks.
A rising wedge points upwards, and a rising price reversing to a bear phase is signalled when the price breaks through the bottom trend line.
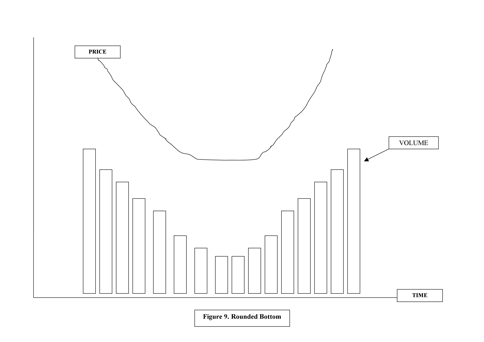
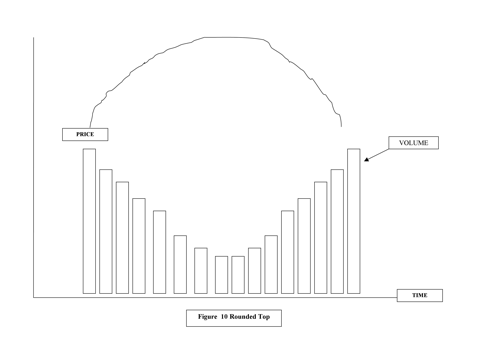
 Rounded Bottom (Figure 9) and Rounded Top (Figure 10)
In a rounded bottom, as seen in figure 9, the volume of gold traded will decrease as the gold price falls. Selling is easing, but buyers have not stepped in. At the bottom of such a cycle, the gold price will move sideways, and volume will flatten. As the gold price begins to rise again, volume of trade picks up. Volume on the way up will almost mirror that of the volume recorded as the price fell previously.
The round top (figure 10) has the same volume pattern as the rounded bottom, though the price movement is opposite as the price moves from an upward trend to a new downtrend.
