Trading Charts


Trading charts are crucial for spotting asset price patterns and trends that can give traders a competitive edge. Though all charts display asset prices over time, the variety of indicators and chart types available makes them a highly versatile tool.
Whether you’re looking at day trading using 3-minute crypto charts or swing trading with daily forex charts, look no further. In this tutorial, we discuss the meaning of trading with charts, features to look out for and the best trading chart strategies.
Live Chart
All the live price charts on this website are delivered by TradingView, which offers a range of accounts for anyone looking to use advanced charting features.
Brokers With Trading Charts


What Are Trading Charts?
Trading Charts Explained
Trading charts show the change in asset price over time, which can be analysed to spot patterns and trends that provide buy or sell signals. The price is depicted on the vertical axis, while the timeframe is shown on the horizontal axis. Trading charts are a flexible but essential tool for technical trading, covering all markets including forex, stocks, commodities (gold, silver, oil and even soybeans) plus crypto such as Bitcoin. Investing charts are also useful when trading derivative products such as options and futures.
Where To Find Trading Charts
Interactive trading charts are often included in the platform software provided by online brokers. These may be industry platforms such as MetaTrader (MT4 and MT5), or brokers’ proprietary platforms. Traders can overlay their analysis on these live trading charts to predict future prices.
UK traders can also view free live trading charts online on websites such as TradingView, Uniswap or through search engines such as Google and Yahoo. These real-time online free trading charts allow users to overlay indicators, with TradingView even providing some innovative 3D trading charts.
TradingView permits users to access their trading charts library on their own website via an API, for example using React JavaScript (JS) or React Native for app development, with open source code available on GitHub. It also provides backtesting solutions to check if trading chart strategies would have been profitable in the past. Alternatively, Jigsaw is an innovative trading platform that provides tools and dashboards for in-depth analysis of trading charts.
Cryptocurrency traders can view live crypto training charts on an exchange website such as Kraken or CoinMarketGap, where the crypto history is also explained.
Trading Chart Features
Selecting the correct chart type, timescale and indicators are essential when analysing trading charts.
Chart Types
Different chart types can be used to display price information in various ways. Here we explain the most common types of trading charts.
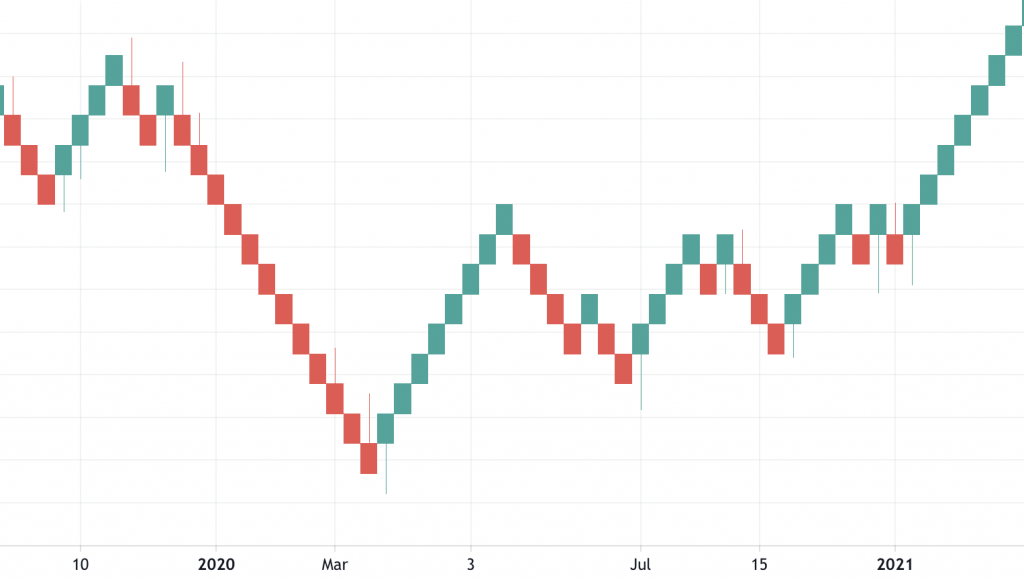
- Candlesticks – this is the most common type of trading chart and is recommended for beginners. Candlestick trading charts are a combination of bar and line charts and are used to show the high, low, open and close prices for the time period specified.
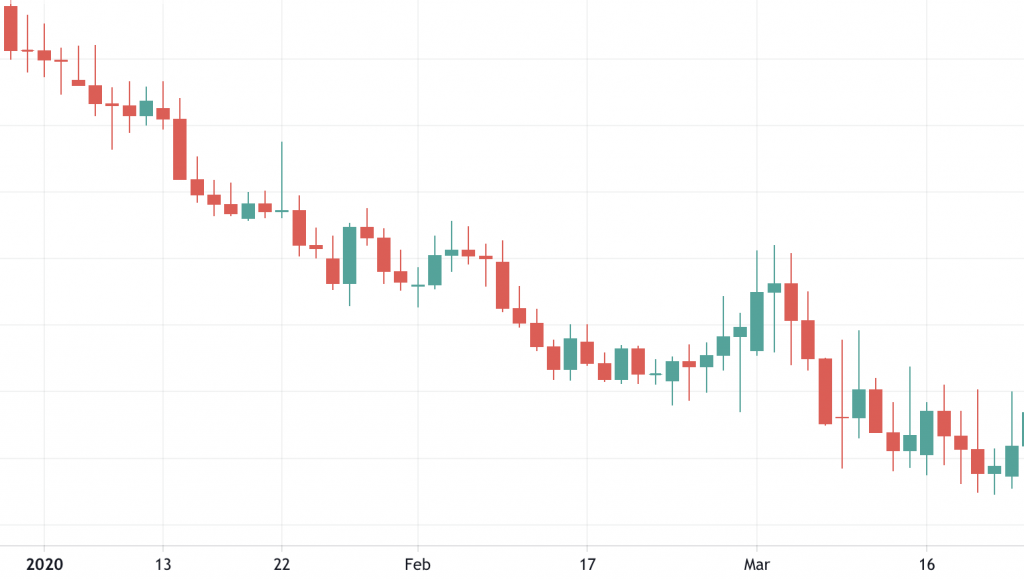 The thicker part of the candle is called the body, while the lines are referred to as the wicks. Typically, green is used to show a bullish candle and red is used for a bearish candle, though any colour can be used. Traders can analyse candlestick charts for patterns such as the hammer and morning star.
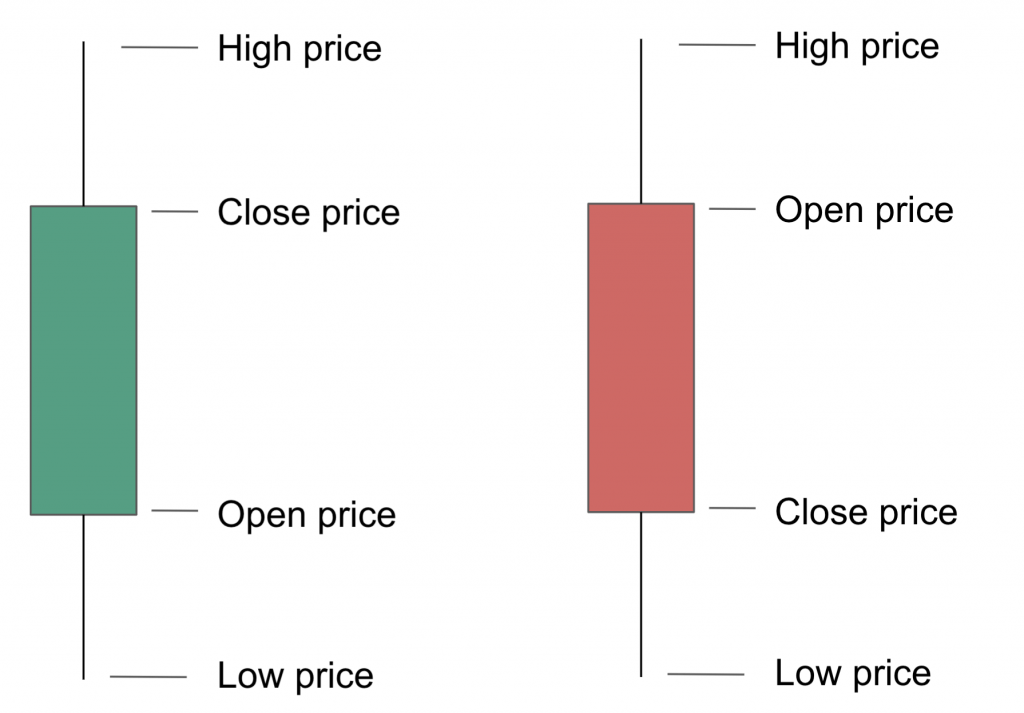
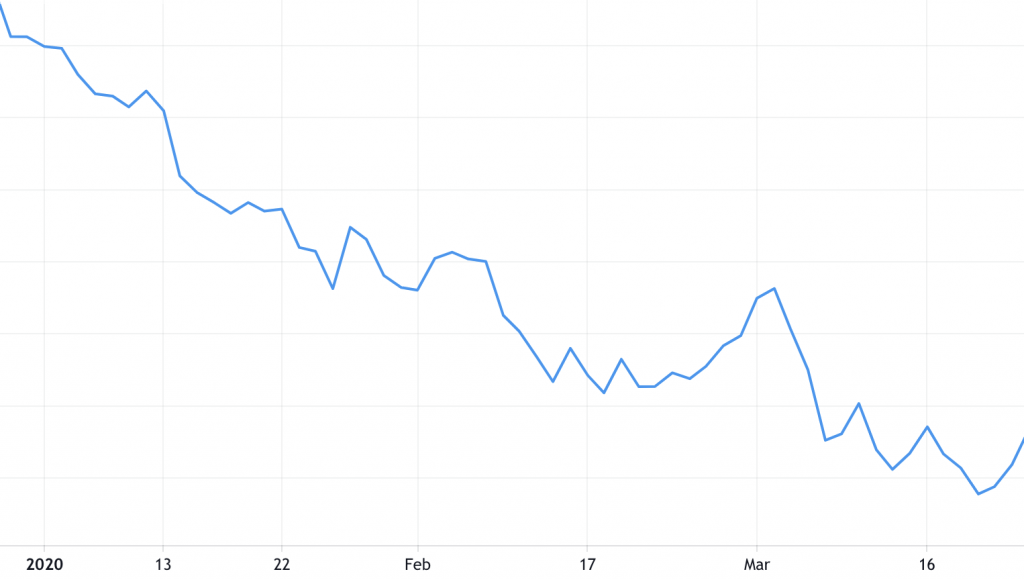
- Line chart – line charts usually just show the closing price of an asset, meaning they provide less information than candlestick charts but are also clearer to visualise. They are therefore a good option for viewing the overall trend.
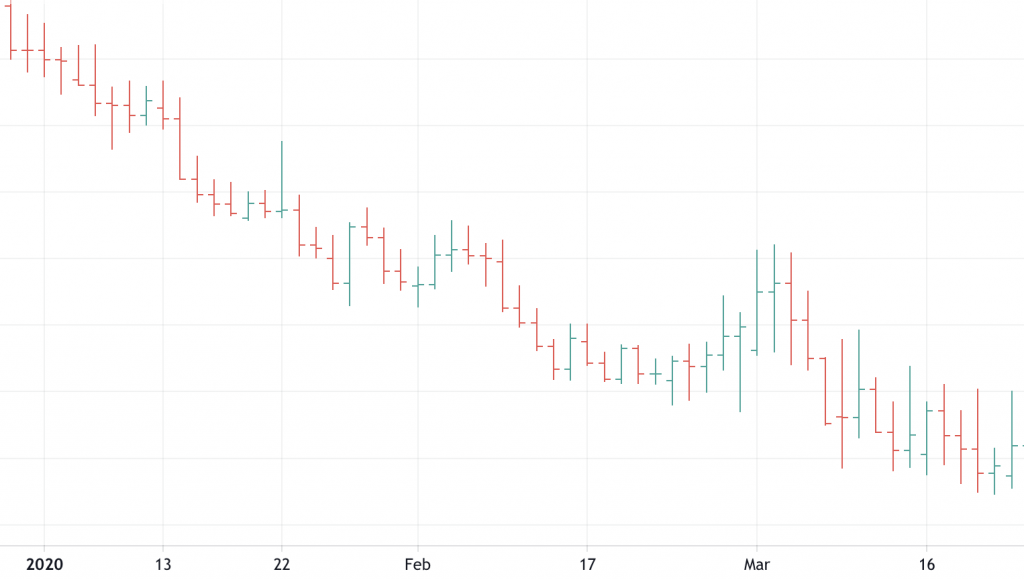
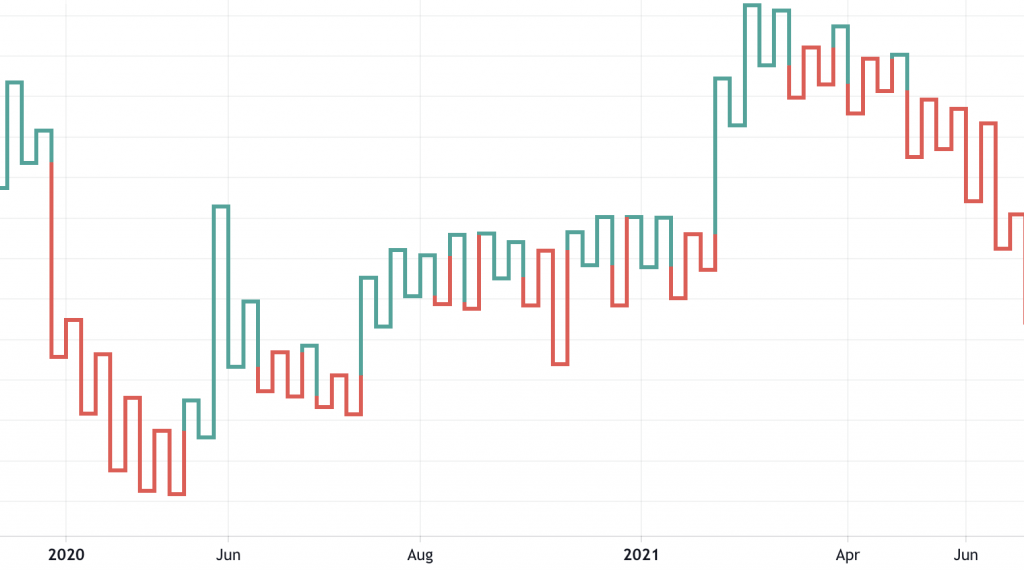
- Bar chart – trading bar charts are very similar to candlestick charts as they display the opening, closing, high and low prices for an asset. The minor difference is that the bar chart focuses on the closing price of the previous period, while the candlestick focuses on the opening price of the current period.
- Renko chart – these trading charts are less common but a useful way of viewing changes in price movement rather than the price at a defined time interval. They highlight price changes during high trading volumes while filtering out small price movements. Renko charts are similar to tick charts, although they also show price direction.
- Kagi chart – these trading charts display price reversals above a certain threshold. If the price moves above the previous high, the line turns thick or green. If it drops below the previous low, it becomes thin or red again. A change from red to green is a buy signal and vice versa.
Timescale
The horizontal axis of the chart determines the time range of the asset price being viewed. With interactive charts, traders can zoom and scroll to select different time periods. Forex scalpers will be most interested in short timeframes such as 5 second to 1-minute trading charts, while forex day traders may look at hourly charts and those swing trading may use hourly or daily charts. Longer-term investors may look at weekly or even monthly trading charts.
Note that timescales are sometimes referred to using the letters M, H, D, W and MN which represent minute, hour, day, week and month, respectively. M1, M2 and M5 are common trading charts that have a period of 1 minute, 2 minutes and 5 minutes, while 1H, 2H, 4H and 8H represent 1-hour, 2-hour, 4-hour and 8-hour timescales respectively.
Indicators
Indicators are the tool used to identify price patterns. They can be categorised into trend, momentum, volatility and volume indicators. In the next section, we provide examples of how to use them.
Example Trading Chart Strategies
Trend line
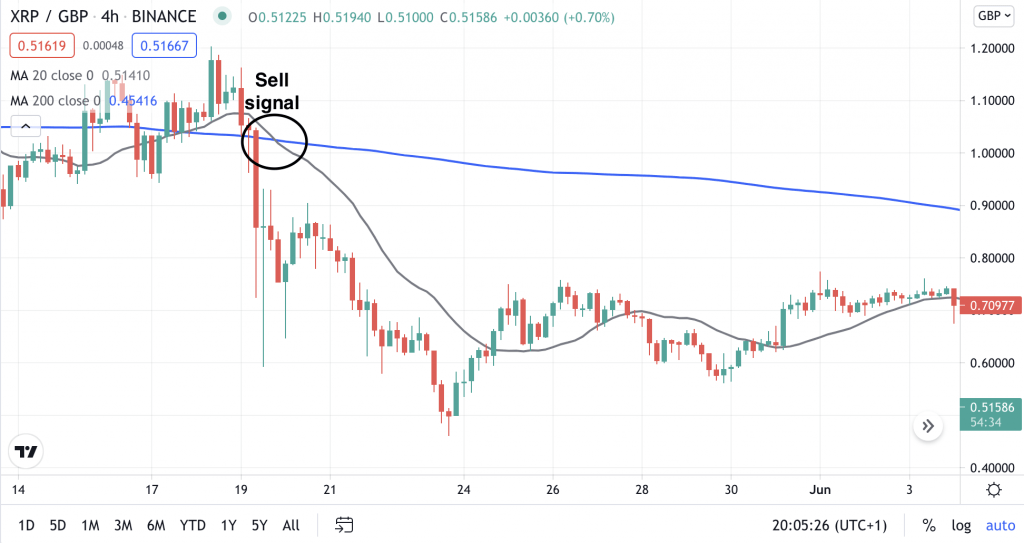
Moving average indicators display the asset price trend, which can provide buy and sell signals. Select a longer period moving average (e.g. 200 days) in combination with a shorter period moving average (e.g. 20 days) and look out for a crossover. A shorter-term indicator crossing above a longer-term indicator is a buy signal. If it crosses below, it’s a sell signal, as shown in the 4hr (four hour) XRP/GBP trading charts example.
Volume
Volume indicators can be used to understand the interest that traders are taking in an asset. High volume with an uptrend can indicate that the price will continue to rise, while high volume with a downtrend can indicate that the price will continue to drop. The Volume Weighted Average Price (VWAP) shows the average asset trading price by taking into account volume as well as price. This liquidity indicator enables traders to see the price for which traders are willing to buy or sell the asset on trading charts, by taking into account Level 2 information.
Depth charts show the number of open buy and sell orders for an asset, which can also be used to judge the asset’s liquidity and provide a buy or sell signal, as explained in the VWAP example.
Momentum
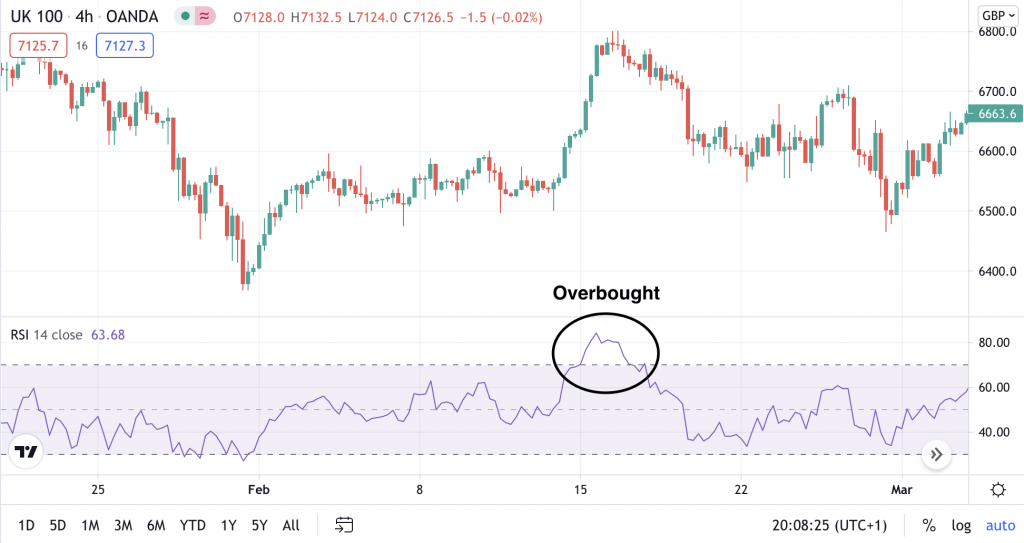
The Relative Strength Index (RSI) is an example of a momentum indicator that calculates recent price changes to determine whether an asset is undervalued or overvalued. It does this using a scale of 0 to 100, where a value under 30 usually indicates an oversold condition, and a value over 70 indicates an overbought condition, as shown in the 4hr UK FTSE 100 example.
Trading Charts Tips
Here we list some of our top tips for trading charts:
- YouTube offers a huge array of video resources on trending charts and longer-term strategies explained in real-time for assets including crypto, forex and stocks by authors like TradingView.
- Educational analysis and patterns books such as ‘Trading With Charts For Absolute Returns’ or ‘Candlestick Charting for Dummies’ explain how to spot different patterns such as the triangle or cup and handle.
- Keep trading chart colour schemes, background and wallpaper images neutral to ensure the information is clear. TradingView allows users to view several charts per tab, for example using the 2 or 4 charts-in-one layouts, selectable via the tools menu.
- Open a demo account with a broker to practice reading and trading using new types of charts. Traders can also download the TradingView charts desktop software for free to try out different indicators.
- Some courses offer summary and analysis pdfs about trading with charts. Examples include understanding trading charts for beginners, analysis and forex trading charts explained.
- Make use of online trading chart cheat sheets and posters that summarise trading patterns to avoid digging through lengthy explanations.
- The Incredible Charts trading diary newsletter is a great way to gradually learn about technical analysis and indicators. New traders can then test their knowledge in an online trading charts quiz.
- Use trading chart indicators (technical analysis) in combination with fundamental analysis for the best signals. The Trading Economics website has a great selection of fundamental indicators including global inflation rates, GDP and tax rates data to enhance the analysis of trading charts.
- Many platforms allow investors to place trades directly from trading charts. Platforms may also have other integrated features such as the ability to set limit orders, as provided by MetaTrader.
Pros Of Trading Charts
Using trading charts offers several advantages:
- Trading charts are a versatile way to spot patterns and trends. Chart types, timescales and indicators can be varied depending on the market and asset being traded.
- Deeper insights can be provided when using trading charts correctly, giving the trader a competitive edge.
- Historic data can be viewed as well as today’s information, which is also useful when viewing futures quotes.
Cons Of Trading Charts
There are also some drawbacks to trading charts:
- Setting the correct trading charts parameters can be overwhelming. Equally, understanding what a trading chart is telling you is not always straightforward and may provide conflicting signals when using different indicators.
- Just because technical analysis has been carried out, does not mean it is correct!
Final Word On Trading Charts
Whether you’re live trading Dow Jones, NASDAQ, NYMEX, SPY or NIFTY on NSE, long-term trading or intraday trading, it’s likely that trading charts can be used to your advantage. Though it is possible to carry out day trading without charts, as explained in the Jigsaw YouTube channel, learning how to apply technical analysis properly will give you an invaluable edge over other traders.
FAQs
What Are Trading Charts?
Trading charts show changes in asset price over time by displaying the price on the vertical axis and timeframe on the horizontal axis. Traders can carry out technical analysis by using indicators to identify patterns and trends that provide buy and sell signals.
What Are The Best Types Of Trading Charts In The UK?
The most common types of trading charts include candlesticks, bar charts and line graphs. While candlesticks provide the trader with more information by showing the open, close, high and low price of an asset, line graphs can be a clearer way to view overall trends by removing some of the noise.
What Is The Best Way To Practice Using Trading Charts?
Traders can practise using trading charts by opening a demo account with a broker. Alternatively, websites such as TradingView offer free charts tutorials and interactive graphs that allow users to test different chart types and indicators. They also have online support if your TradingView charts are not updating or loading.
What Are The Advantages Of Using Trading Charts?
Trading charts can give traders an advantage when predicting future prices through the identification of patterns and trends. They can be applied to all assets and used for all types of trading, from scalping to long term investing.
What Are The Best Trading Chart Indicators?
Some of the best trading chart indicators include moving averages to detect trends, and the Relative Strength Index (RSI) to detect if an asset is oversold or overbought. However, indicators can be layered to provide deeper insights.