Technical Analysis


Technical analysis uses patterns and indicators to predict future prices based on historical data. It is a versatile trading technique that can be applied to all markets including forex, crypto, stocks and commodities like gold. However, it is most suited to shorter-term trading, which is less likely to be impacted by economic news.
In this guide, we provide the definition of technical analysis, explain how to carry out technical trading and walk through example strategies.
Top 3 Brokers in the UK
-


Founded in 2008 and based in Israel, Plus500 is a leading brokerage with over 25 million registered traders across more than 50 countries. It focuses on CFD trading, offering a user-friendly proprietary platform and mobile app. The company provides competitive spreads and does not impose commissions or charges for deposits or withdrawals. Plus500 stands out as a highly trusted broker, licensed by respected authorities such as the FCA, ASIC, and CySEC.
Instruments Regulator Platforms CFDs on Forex, Stocks, Indices, Commodities, ETFs, Options FCA, CySEC, EFSA, ASIC, FMA, FSCA, MAS, ISA, FSA, DFSA, SCA, JFSA, SCB, CIRO, BAPPEBTI, OJK, BI WebTrader, App Min. Deposit Min. Trade Leverage $100 Variable Yes -
eToro is a leading multi-asset platform providing trading services across numerous CFDs, stocks, and cryptocurrencies. Since its 2007 inception, it has attracted millions of traders worldwide. It operates with authorisation from top regulators such as the FCA and CySEC. Its social trading feature is especially well-regarded. Crypto investments are high-risk and possibly unsuitable for retail investors. There's a potential to lose all invested capital. Familiarise yourself with the risks. 61% of retail CFD accounts incur losses.
Instruments Regulator Platforms CFDs, Forex, Stocks, Indices, ETFs, Smart Portfolios, Commodities, Futures, Crypto, NFTs FCA, CySEC, MiCA, MFSA, FSRA, ASIC, FSAS, MAS, GFSC eToro Web, CopyTrader, TradingCentral Min. Deposit Min. Trade Leverage $50 $10 1:30
Safety Comparison
Compare how safe the Technical Analysis are and what features they offer to protect traders.
| Broker | Trust Rating | FCA Regulated | Negative Balance Protection | Guaranteed Stop Loss | Segregated Accounts |
|---|---|---|---|---|---|
| Plus500 | ✔ | ✔ | ✔ | ✔ | |
| eToro | ✔ | ✔ | ✘ | ✔ |
Payments Comparison
Compare which popular payment methods the Technical Analysis support and whether they have trading accounts denominated in British Pounds (GBP).
| Broker | GBP Account | Debit Card | Credit Card | Neteller | Skrill | Apple Pay |
|---|---|---|---|---|---|---|
| Plus500 | ✔ | ✔ | ✔ | ✘ | ✔ | ✔ |
| eToro | ✔ | ✔ | ✘ | ✔ | ✔ | ✘ |
Mobile Trading Comparison
How good are the Technical Analysis at mobile trading using apps or other mobile interfaces.
| Broker | Mobile Apps | iOS Rating | Android Rating | Smart Watch App |
|---|---|---|---|---|
| Plus500 | iOS, Android & Windows | ✘ | ||
| eToro | iOS & Android | ✘ |
Beginners Comparison
Are the Technical Analysis good for beginner traders, that might want an affordable setup to get started, along with good support and educational resources?
| Broker | Demo Account | Minimum Deposit | Minimum Trade | Support Rating | Education Rating |
|---|---|---|---|---|---|
| Plus500 | ✔ | $100 | Variable | ||
| eToro | ✔ | $50 | $10 |
Advanced Trading Comparison
Do the Technical Analysis offer features that allow for more advanced trading strategies?
| Broker | Automated Trading | Pro Account | Leverage | VPS | AI | Low Latency | Extended Hours |
|---|---|---|---|---|---|---|---|
| Plus500 | ✘ | ✘ | ✔ | ✘ | ✔ | ✘ | ✘ |
| eToro | Automate your trades via CopyTrader - follow profitable traders. Open and close trades automatically when they do. | ✘ | 1:30 | ✘ | ✔ | ✘ | ✔ |
Detailed Rating Comparison
Use this heatmap to compare our detailed ratings for all of the Technical Analysis.
| Broker | Trust | Platforms | Mobile | Assets | Fees | Accounts | Support | Research | Education |
|---|---|---|---|---|---|---|---|---|---|
| Plus500 | |||||||||
| eToro |
Our Take On Plus500
"Plus500 provides a seamless experience for traders with its CFD platform, featuring a sleek design and interactive charting. However, its research tools are basic, fees are higher than the most economical brokers, and its educational resources could be improved."Tobias Robinson
Reviewer
Pros
- AI Bites provides active traders with real-time, AI-driven market summaries, technical analysis, and social sentiment integrated with charts, assisting with short-term trading decisions.
- The broker provides low-commission trading across varied markets, reducing extra fees and attracting seasoned traders.
- Plus500 has expanded its range of short-term trading instruments by adding VIX options, which feature increased volatility. Additionally, it has extended trading hours for seven stock CFDs.
Cons
- Educational resources are not as extensive as leading brokers such as eToro, which affects beginners' ability to learn quickly.
- Compared to competitors like IG, Plus500 offers limited research and analysis tools.
- Algorithmic trading and scalping are not available, potentially deterring certain traders.
Our Take On eToro
"eToro's social trading platform excels with its outstanding user experience and lively community chat, aiding beginners in spotting opportunities. It offers competitive fees on numerous CFDs and real stocks, alongside exceptional rewards for seasoned strategists."Tobias Robinson
Reviewer
Pros
- In 2025, eToro altered its fee structure by separating crypto trading fees from the spread. A distinct commission is now listed separately, providing traders with increased transparency while maintaining consistent overall costs.
- The web platform and mobile app receive higher user reviews and app rankings compared to leading competitors like AvaTrade.
- The trading app provides a top-tier social environment featuring an engaging feed and community chat, which we enjoy using.
Cons
- The only significant contact option, besides the in-platform live chat, is limited.
- There are no assured stop-loss orders, which could be a valuable risk management tool for novice traders.
- The minimum withdrawal is set at $30, accompanied by a $5 fee. This may impact traders with limited funds, particularly those just starting out.
What Is Technical Analysis?
Technical trading finds chart patterns and trends in price and volume data to predict future movement. There are numerous ways to carry out technical analysis, from the chart type or indicator selected, to the timeframe used. However, whether it’s the analysis of stocks, crypto, S&P 500 or NASDAQ that you’re interested in, the same overall principles apply.
Technical Analysis Versus Fundamental Analysis
Fundamental analysis is the method used to determine the underlying value of an asset, focusing on economic news and company reports. In contrast, technical analysis is concerned with the price at which the asset is trading, looking at ‘what’ the data is predicting, rather than trying to understand the ‘why’.
For this reason, technical analysis is more likely to be used by traders, with longer-term investors placing more emphasis on fundamental analysis. However, using both technical and fundamental analysis in combination is the best way for traders to gain a competitive edge.
How To Start Technical Trading
Find A Broker
A broker is essential when carrying out any type of trading. When selecting a broker, consider which platforms they offer and whether they provide the technical analysis tools you require. This includes graph types, leading indicators and the overall useability of the software. MetaTrader 4 and MetaTrader 5 are industry-recognised platforms that offer a huge variety of indicators through an intuitive interface, also available via a mobile app. Other things to look out for include fees charged by the broker and whether or not they offer a demo account.
For traders looking to hold currency or crypto only, consider exchanges such as Coinbase as an alternative to traditional brokers.
Select The Asset & Timeframe
Technical analysis can be used for any type of trading including cryptos, commodities or the stock market. However, what you are trading may influence the timescale required. For example, short-term technical trading such as day trading or even scalping is more suited to highly volatile assets such as cryptocurrency. Traders wanting to spot longer-term stock trends will require a larger timeframe.
A technique adopted by some traders is using multiple timeframes. This method is a way to provide more confidence in a position, by viewing the trade from another angle. For example, a 5 minute timeframe could be used to confirm a position chosen using a 15 minute timeframe.
Choose An Indicator
Indicators use mathematical calculations to predict volume as well as price, usually by plotting lines and markings on a chart. These indicators can show trends within the data, such as whether it is a strong bull market. They can also provide signals that identify when to enter and exit a position, based on momentum, volume and volatility.
These indicators fall into two main categories: leading and lagging. While a lagging indicator is a report of previous price information that can be used to confirm an entry position, a leading indicator aims to predict future price movements. Leading indicators therefore have the potential to predict future prices before they occur. However, as they are not always accurate, the best results come from using both types in combination.
Technical Analysis Strategies
Here we explain three of the most common technical analysis types: analysing trends, momentum and volatility.
Moving Averages
The moving average indicator is a popular strategy used to spot trends in market prices. It works by plotting the average price over a defined period of time, allowing the trader to filter out spikes and fluctuations and visualise the overall trend.
Multiple moving average indicators can be used together to provide further information. In the example below, 20 and 200 period moving averages are selected, meaning the price is averaged over the previous 20 and 200 days respectively. While the 200 period moving average shows a long term trend, the 20 period moving average shows shorter-term dips.
The shorter-term moving average crossing above the longer-term moving average is a bullish indicator, known as the ‘Golden Cross’. The opposite is a bullish indicator, called the ‘Death Cross’.
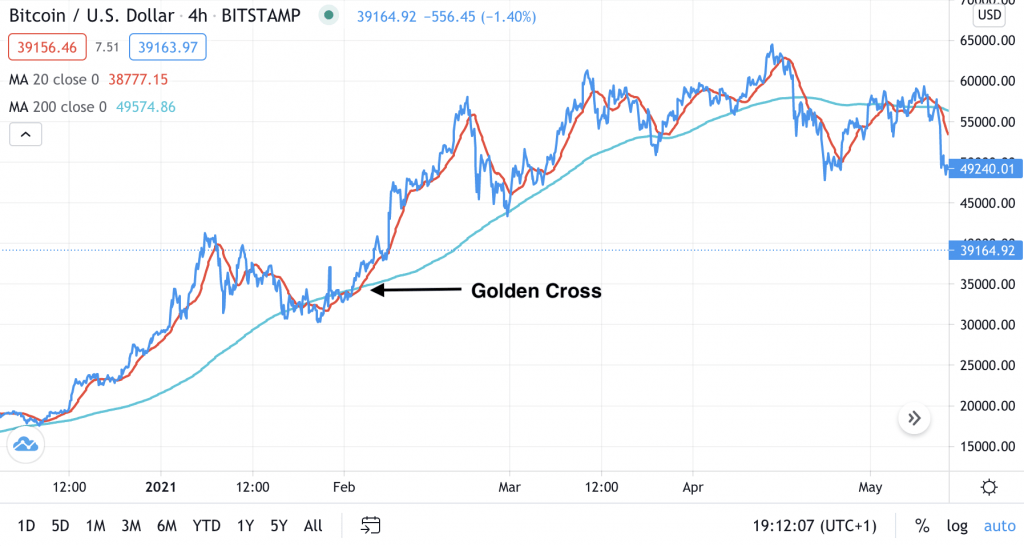
Moving Average Golden Cross Technical Analysis Strategy
Alternative trend indicators include the Exponential Moving Average (EMA) which applies a higher weighting to more recent data, and the Moving Average Convergence Divergence (MACD) indicator, which shows the relationship between two moving averages.
Directional Movement Index
The Directional Movement Index (DMI) is another method that can be used to analyse price trends. A positive directional movement line (DI+) and negative directional movement line (DI-) indicate the direction in which a price is moving:
- If DI+ is above DI-, the price is trending upwards (confirming a long position)
- If DI- is above DI+, the price is trending downwards (confirming a short position)
This can be used in combination with a third line, the average directional index (ADX), which is an indicator of the strength of a trend. An ADX of above 25 is considered a strong trend.
In the example below, a strong trend is highlighted by the ADX (pink line), with the DI- (orange line) crossing above the DI+ (blue line), signifying a bear market.
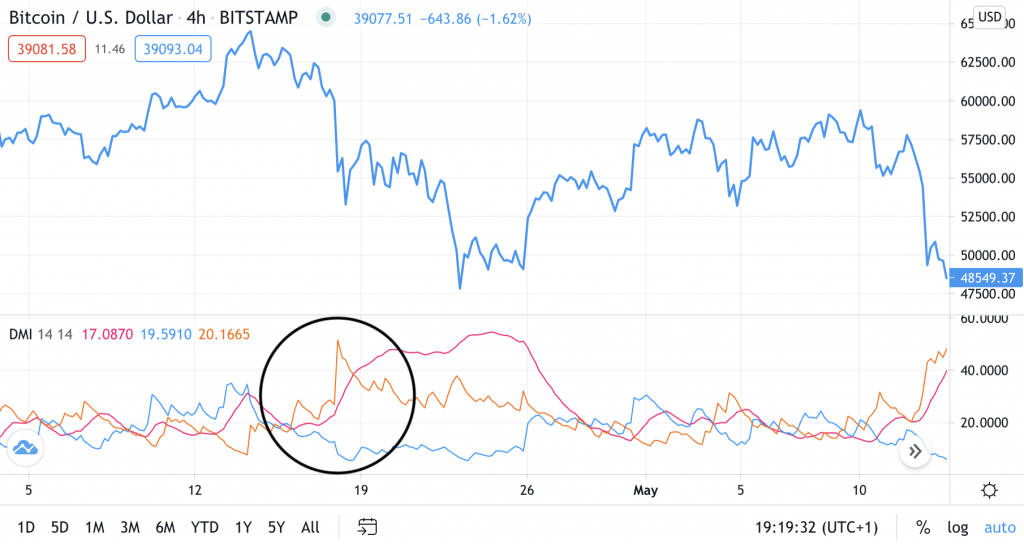
The DMI Is Used To Determine The Direction and Strength Of A Trend
RSI
The Relative Strength Index (RSI) is an example of an oscillator, which are indicators of momentum. It uses a scale of 0 to 100 to measure the rate of change of a price, which is a guide to the volume being bought and sold. Generally, a reading below 30 is used to indicate that the asset is oversold, while a reading above 70 indicates an overbought asset.
The RSI is an example of a technical analysis indicator that can be used to determine a trading range, which is when the price is seen to oscillate within a fixed range (between support and resistance bands). Ranges can also be determined using Fibonacci retracement levels.
Stochastic Oscillator
The Stochastic Oscillator is an alternative momentum indicator that also uses a range of 0-100 to determine overbought and oversold conditions. However, instead of looking at the rate of change of price, the highest and lowest trading prices in a defined historical trading period are used to indicate the momentum, resulting in a slightly different signal:
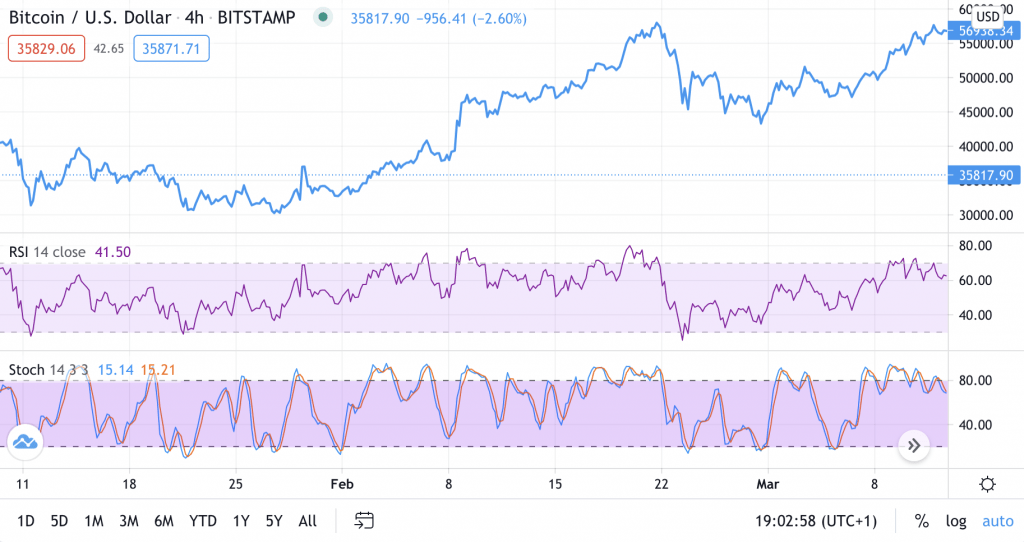
RSI And Stochastic Oscillator Comparison
Bollinger Bands
Bollinger bands can be used to analyse the volatility of an asset. The indicator consists of a moving average (brown line) with bands on either side, reflecting two standard deviations above and below the price. Bands that are further apart reflect higher volatility and can be used to determine entry and exit points.
For example, the squeeze strategy looks for a contraction (or squeeze) in the Bollinger Bands, which is a sign of a subsequent breakout of the price and can be traded accordingly. To protect against a breakout in the opposite direction, a stop loss is usually placed on the opposite side of the trade.
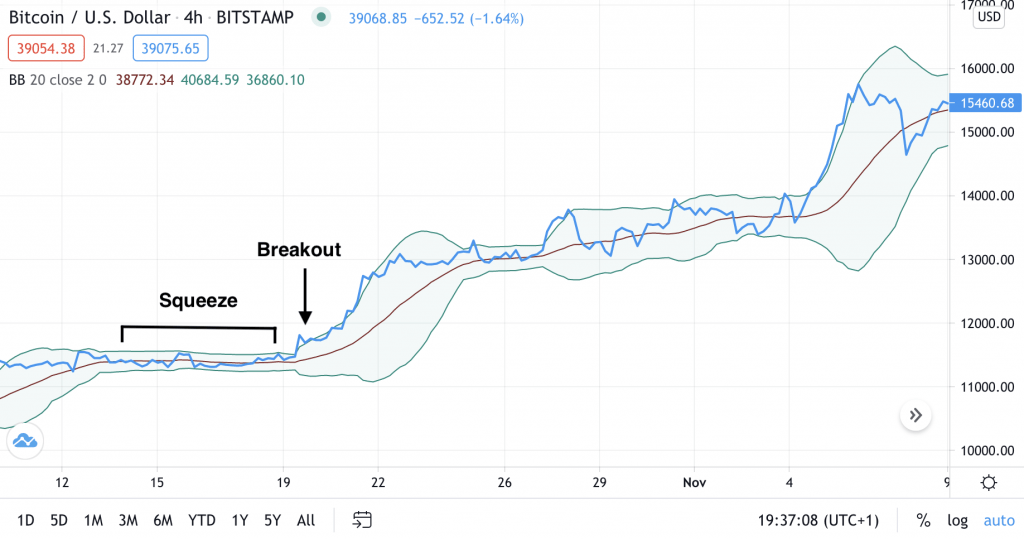
Bollinger Bands Squeeze Strategy
Technical analysis can also be carried out using methods that simply look for reversal patterns within candlestick charts and graphs. These include head and shoulders, triangles (including rising wedge, ascending and descending), hammers, bull flags and pennants.
Automated Technical Analysis
As well as applying indicators manually, trading bots can be programmed to carry out technical analysis and place trades automatically. Using a pre-existing trading library from a programming language such as Python makes the development of trading algorithms much quicker. For traders using the MetaTrader platforms, free and paid-for bots can be downloaded from the MQL source code library.
Technical Analysis Tips
Here we list some key tips to keep in mind when technical trading:
- Less is more – while it might seem like a good idea to layer as many indicators as possible to give in-depth analysis, this can lead to a situation where they become too complex to manage or even contradict each other. Make sure each indicator has a clear purpose and are working together to enhance the analysis.
- Carry out research – there are lots of books and online resources available to learn different technical trading techniques. Famous books include ‘Technical Analysis of the Financial Markets’, by John J. Murphy (also available online as a pdf or audiobook) and ‘Technical Analysis for the Trading Professional’. Online training courses are also a good way for beginners to get started.
- Practise first – one of the best ways for beginners to start learning the basics of technical analysis trading is to practise. By opening a demo account with a broker, traders can practise technical analysis on real markets with virtual funds, before risking their own capital.
- Follow online forums – while online forums should not be followed blindly, websites such as Quora and Reddit can be a hub for sharing new ideas and trading strategies.
- Be aware of the risks – just because technical trading involves calculations does not mean returns are guaranteed. If executed properly it can increase the probability of placing a good trade, but always use stop losses and set limits.
Pros Of Technical Trading
Applying technical analysis when trading offers several advantages:
- Versatility – technical analysis can be applied to any asset, across any timescale. In particular, it is a good technique to apply to short-term trading, which is less influenced by news reports and company announcements.
- Improved insight – when applied correctly, indicators provide useful insights that can give traders a competitive edge.
Cons Of Technical Trading
However, there are also a number of limitations associated with technical analysis:
- Ambiguity – there is no one right way to carry out technical analysis, which can make it difficult to get started. Different indicators can give conflicting answers, which may change when altering timescales and settings too.
- Accuracy – historic data is not always an indicator of future price, especially when economic news has an impact. Ensure you are aware of fundamental information such as company announcements which may have a large effect on price.
Final Word On Technical Trading
Technical analysis is an adaptable technique that can be used to predict future prices based on patterns and trends across all assets. However, traders should be aware of the limitations of technical trading which does not provide guaranteed results and can often be ambiguous. Carrying out technical analysis in combination with fundamental analysis and using appropriate risk management is the best way to increase the likelihood of placing profitable trades. Use our tutorial above to get started.
FAQs
What Is Technical Trading?
Technical trading uses patterns and indicators (mathematical calculations) to predict future prices based on historical and current data. This information can be used to identify trends and signal entry and exit points.
What Is The Difference Between Technical Analysis And Fundamental Analysis?
Technical analysis is concerned with the price at which an asset is trading, unlike fundamental analysis which tries to calculate the underlying value of an asset. Using technical analysis without any fundamental analysis runs the risk of missing economic news such as company announcements that can have a large impact on price.
What Are The Best Technical Trading Indicators?
Some of the best technical trading indicators are the most straightforward ones. Examples include the moving average indicator to display trends, the RSI to indicate oversold or overbought regions, or Bollinger Bands to indicate volatility.
What Are The Risks Associated With Technical Trading?
The key risk associated with technical analysis is applying it in isolation to carry out a trade. Instead, combine it with fundamental analysis, adequate stop losses and risk management.
How Do You Start Technical Trading?
To start technical trading, find a broker that offers a platform with the required charting tools and indicators. Additionally, define a plan that includes your selected timescale, technical analysis strategy and approach to risk management.