Simple Breakout Strategy
The principle behind the 4 hour breakout strategy is a simple one and has been derived as a result of extensive studies that have clearly shown that there are always periods in the market when breakouts occur. Several 4 hour breakout strategies exist, but this one is unique and will only require being set up once a week. After being setup on Sunday night at the open of trading for the week, the trade is left for the week and closed out.
Top UK Brokers For The Breakout Strategy
Assets Traded
a) USD/JPY
b) GBP/JPY
c) EUR/JPY
d) CHF/JPY
It should theoretically work on other Yen crosses but these have not been thoroughly tested for this strategy.
Trade Technique: 4Hr Charts
The platform used in setting up this strategy is the MT4 platform. After opening the MT4 platform, the trader should click on Ctrl + Y to display the vertical grid lines over the currency asset to be traded at 0000hrs (i.e. 2300hrs GMT).
Once the grid lines are up, the trader draws lines or a box to fit the size of the first candle of the week. This serves as a visual aid to enable the trader use the low of that candle as a selling point and the candlestick’s high as the buying point. In order to make some allowance for some little price movements above and below that candle, it is recommended to add a buffer of 5 to 10 pips above the candle high and below the candle low. This prevents price oscillations of a few pips from triggering a stop loss if the trade goes in the opposite direction.
Setting Stop Loss and Profit Targets
Two profit targets are used. The first is positioned 70 to 75 pips from entry point while the second is positioned at about 150 pips from trade entry. The stop loss is set 50 pips. This gives a risk to reward ratio of 1:1.5 to 1:3.

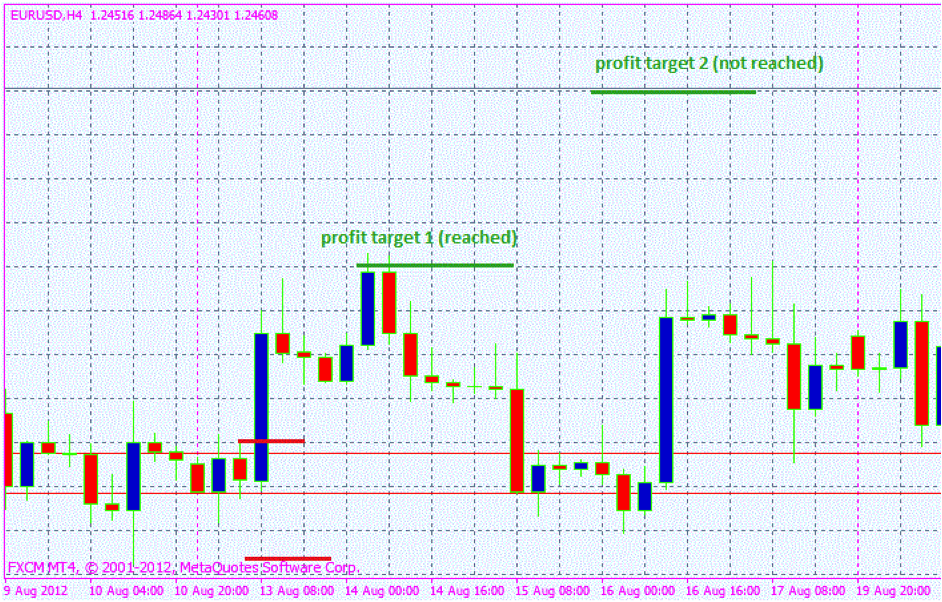
Look at the chart above. The purple vertical broken grid line marks the open candle for the week. The two horizontal red trend lines demarcate the upper and lower limits of that candle with an allowance of 10 pips on each side. The trade concept is to look for a full breakout on either side and follow it with a profit target of 75 pips and stop loss of 50 pips in the first instance. Prices broke out upwards and eventually hit the 75 pip target, but failed to meet the second target.
Trade Technique 15 Minute Chart
An easier variation of this strategy is available for short term traders on the 15 minute chart. Let us look at how to set this strategy up on the 15 minute chart.
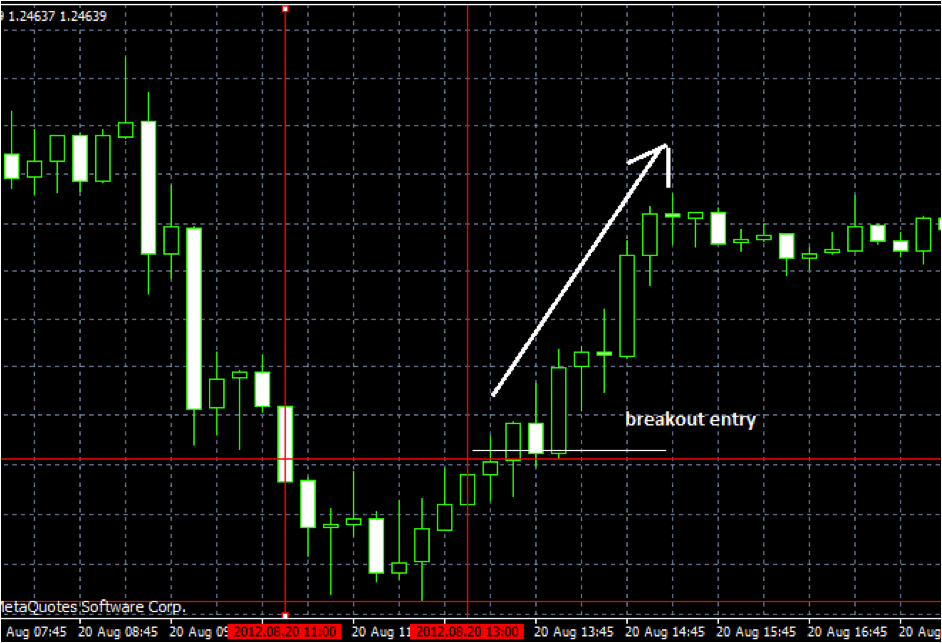
Using the 15 minute time frame, we have a modification of this strategy designed to benefit from the New York breakout that occurs from 7am to 9am EST. The New York session is the last session to open for the day from the global standpoint. By this time, a lot would have happened in Asia and in Europe, and the markets in the New York time zone would be itching to go crazy by reacting to all the developments from the previous two regions. From 7am to 9am EST the New York Stock Exchange which corresponds to the first two hours of business, traders in the New York zone make the markets go haywire. This is the time to take advantage of the massive price movement that occurs at this time. Take a look at the snapshot to see how the trade is organized.
This strategy will require the setup of two vertical grid lines at 1100 GMT & 1300 GMT as well as two horizontal trend lines at the lowest candle low and the highest candle high.
Then just like in the 4hr version of the strategy, sell the currency asset if the price breaks the low line and buy the currency pair if the price breaks the trend line that delineates the high.
Setting Stop Loss and Profit Targets
Since the 15 minute chart is what is used for determining the breakout, the targets should be lower than for a 4hour chart. Hence the trader should not target more than 30 – 40 pips target. Stop loss should be set to 20 pips maximum.

This chart shows a trade example for the 15 minute New York breakout strategy. The vertical lines were applied at 1100GMT and 1300GMT. The horizontal trend lines marked the upper and lower boundaries of price, and once the breakout occurred, it was able to gross 40 pips to the upside.
Between the 15 minute and 4 hour versions of the strategy, we would prefer the 4hour version. But if there are scalpers among us, definitely they should go for the 15 minute version.

