Binary Options Charts
To be successful in binary options trading, a substantial amount of market research and asset analysis is often required. There are some useful tools available, one being charts. Learning to read and analyse binary options charts can be a helpful addition to your trading strategy and can add an interesting element to your investment approach.
This guide will cover how to read and analyse binary options charts, the different types of live and historical graphs available, plus beginner-friendly charting options.
Top 3 Binary Options Brokers
See all Binary Options Brokers in the UK
Binary Options Charts 101
Charts are one of the most valuable tools used by UK investors engaged in binary options trading. A form of technical analysis, graphs are used to forecast future price movements based on historical data trends. They can essentially help you identify where the market is heading and the best time to enter or exit a position.
Today, many online brokers offer a selection of real-time binary options graphs, including line and bar charts. Intricacy and complexity vary, but often charts can be customised to suit personal trading needs.
Note, that past data cannot guarantee upcoming trends. Unforeseen events and macroeconomic factors can impact the price of an underlying asset and even the most experienced technical traders are sometimes caught out.
How Charts Work
Binary options charts work by displaying historical price information alongside past trades to help predict future trends. As a visual tool, charts are used to help retail investors view the price changes that have occurred to an underlying security over a set period, for example, FTSE-listed stocks over the last 12 months.
Importantly, the information plotted on binary options charts will vary. With that said, the time frame is usually displayed at the bottom, running horizontally, while the variable factors are often presented vertically. For example, a chart may display the price movement experienced by the GBP/EUR forex pair over a six-month period. Each point on the graph could represent the closing price of the asset on any given day.
The timescale and price data components are particularly important for traders. The type of binary options contract that you trade, including the expiry time, will influence the type of chart you will need.
Time Scale
The time scale on a graph can vary from minutes to years, with the best brokers offering customisable settings. With that said, binary options charts are typically broken up into the following timeframes; 1, 2, 5, 10, 15, 30, 45, 60, 90 minutes and then daily, weekly, monthly and annual views.
You may find that shorter time scales are more relevant due to the often short-term investment parameters of binary options contracts. Daily charts, for example, will report the price movements across a whole day condensed into one point. Intricate details of price changes can then be reflected in a shorter timescale chart.
Importantly, if you are trading a binary option that expires in one day, there may be limited value in reviewing charts over a five-year period. A long-term view will not necessarily help you predict short-term price trends.
Note, that some brokerage firms have a data delay, sometimes up to 15 minutes, meaning you won’t necessarily view price changes in real-time.
Price
Price parameters are often located on the side of a chart, running vertically. This illustrates an asset’s value compared to historical figures. Again, linked with a customisable time scale, you can view pricing history as far back as required. The best charts will clarify major volatility in relation to significant events.
Importantly, prices can be demonstrated in absolute terms or as a percentage, though this can lead to misleading visuals. For example, an increase in the price of an asset from £30 to £40 is 33% whereas the increase in the price of an asset from £80 to £90 is 13%. In percentage terms, the increase may look much bigger for the £30 to £40 price rise, whereas both just incur a £10 rise in value.
Example
The key benefit of binary options charting tools is that they can help you make more accurate trading decisions. Let’s say you are speculating on a FTSE 100-listed stock. You could use charts to support your forecasting:
- Input the name of the asset into the charting tool using the search bar. This will bring up live pricing data, plus the option to view historical information
- Amend the time frame in line with your binary options contract and strategy. In a daily view, for example, each bar could represent 24 hours. Use the zoom functionality to check how a price pattern varies within the time window
- Use a comparison tool if you wish to compare two or more stocks. This can help you to determine which is displaying a stronger trend, and therefore, which could be the better investment
Fortunately, most binary options brokers allow customisation and the option to save configured settings.
Online Vs Download
Binary options charts can be accessed in two key ways:
- Online – Web-based charts are available directly through brokers’ websites. These charts will require a compatible web browser. On the downside, customisation may be limited.
- Download – Charting software can also be downloaded through your existing trading terminal or via a standalone plug-in. It is worth checking system requirements before attempting a download. Importantly, downloadable software usually offers more advanced features and functionality.
Binary Options Charts
There are several different types of binary options charts available at leading online brokers. There is no right or wrong graph to use, it will mostly come down to personal preference.
Candlestick Chart
Perhaps the most popular charting style when it comes to binary options trading. Candlestick charts condense various data and summarise it visually. It is one of the easiest graphs for beginners to start with. On the downside, many refer to this type of chart as a confirmation tool rather than an aid that can identify investment opportunities.
Japanese Candlestick
The Japanese candlestick price chart summarises the opening, closing, high and low price points of an underlying asset across a given period. Initially created by Japanese rice merchants centuries ago, the graph become popular with retail traders in the 1990s.
As well as being able to view historical price shifts, investors can use Japanese candlestick patterns for indications of where a market may move next. Recognisable shapes often lead to continuations or reversals.
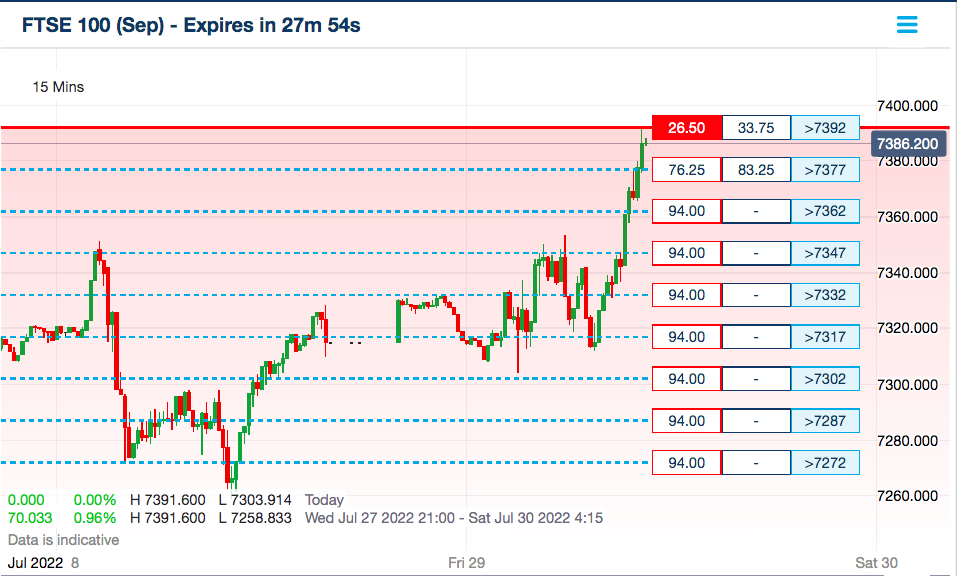
Candlestick Chart
Importantly, you will need to familiarise yourself with the three major components of each candle; body, colour and wick. The ‘body’ of the candle will show the opening and closing prices. The ‘colour’ of the chart will indicate the direction of movement (green usually signifies an upward movement and red a downward movement). The ‘wick’ of the candle will show the high/low range associated with the asset’s price.
Note, that each candle will reflect the period selected for the chart. For example, on a 10-minute chart, each candle will display the open, close, high and low price points across a 10-minute view. When this period is over, a new 10-minute candle will be formed.
Bar Chart
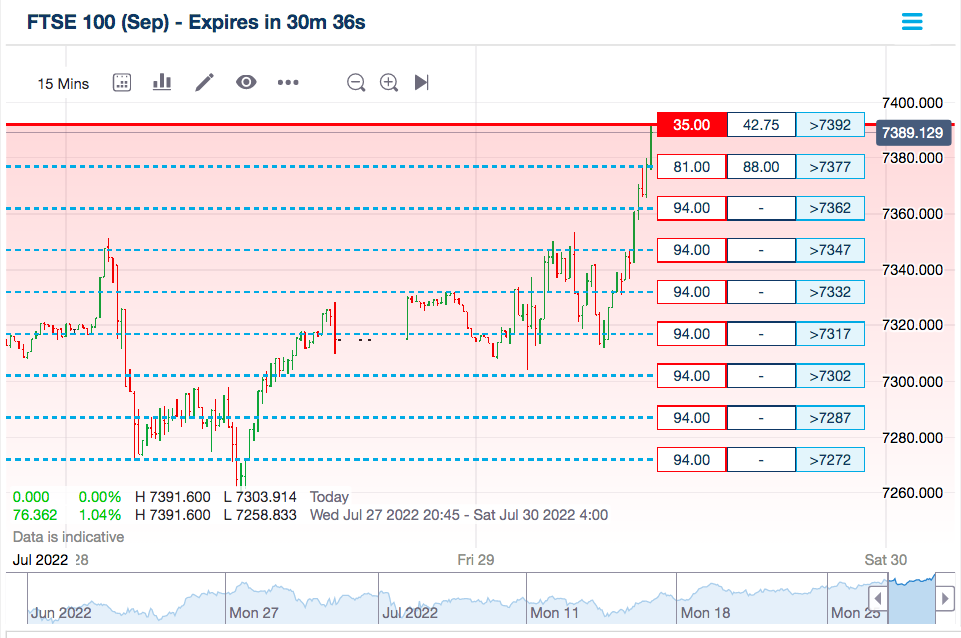
Relatively similar to the candlestick chart, a binary options bar chart also illustrates the opening, closing, high and low price points of an underlying asset across a given period. Each bar consists of a vertical line showing the highest and lowest price reached during a set timeframe.
Again colour coding is often used, and is available on most charting platforms. If the closing price is above the open price, the bar is often green. If the closing price is below the open price, they are normally coloured red.
Bar Chart
Long vertical bars indicate a large price swing between the high and low prices during the time period. This indicates a period of significant volatility. When a bar consists of small vertical bars, it suggests relatively limited volatility.
Line Chart
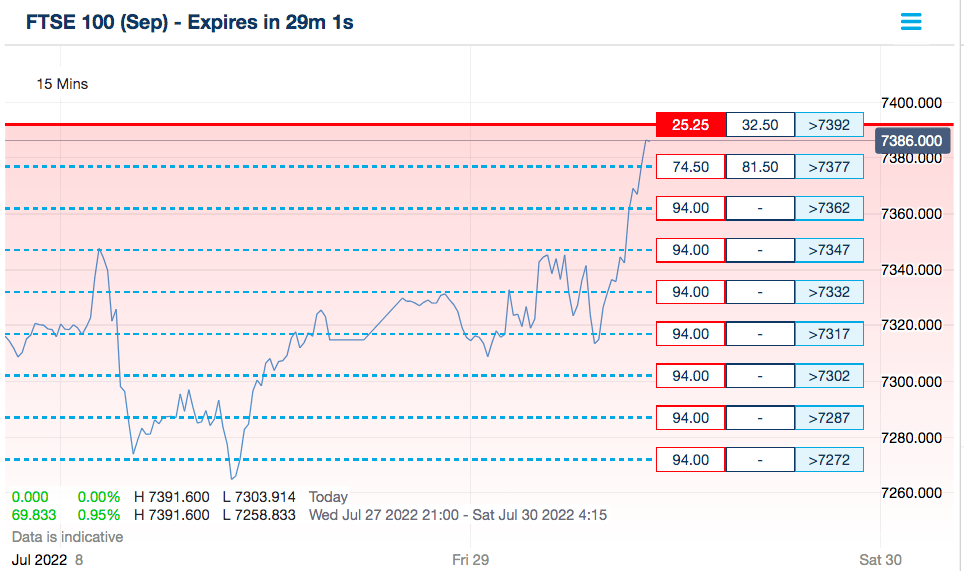
One of the most basic chart types, a line chart is ideal for new or inexperienced binary options investors. The line chart essentially portrays price changes as a horizontal line.
Line Chart
A flaw of this type of chart is that it doesn’t provide data showing the opening and closing prices or the high and low price points. If you use a one-hour Japanese candlestick chart you can clearly view how the price changed during each hour, whereas a line chart won’t display this information.
Tips For Getting Started
Find The Right Broker
You will need to find a broker that offers binary options trading and user-friendly charts and graphs. Because binaries are prohibited by the FCA, UK investors will need to open an account with an overseas brokerage. See our list of recommended brands here.
The best platforms provide access to free or paid-for proprietary or third-party charting tools. Another important consideration is whether a demo account is available. Here, prospective traders can practise using charts and graphs, amending views to find a display that works for them.
Pocket Option, for example, provides access to virtual funds so you can practise integrating charting features in a simulated trading environment.
Costs
The top brokers will offer free charting tools plus advanced graphs and analysis features. These additional technical trading tools may come at a cost, but they can improve your forecasting capabilities. Below we review some well-known charting tools, some of which are available to download for free.
MetaTrader 4 Charts
Recognised as one of the best sources for free charting information and interactivity. Charting tools are integrated directly into the MT4 platform, available via major web browsers or downloadable to Mac and Windows devices. You can view MT4 charts via any brokerage that offers MetaTrader 4 as a supported trading terminal.
Multicharts
Multicharts is an award-winning trading software for charting, backtesting and automation. Features include the ability to create up to 20 sub-charts per view, add dynamic commentary, plus full customisation.
The software allows investors to mix any resolutions, automatically aligning them to the chosen time scale. For example, you can view hourly resolutions with daily resolutions or range bars with volume bars.
A 30-day free trial is available. An annual subscription is £66 per month.
Free Stock Charts (FSC)
Free Stock Charts is available as web-based software or can be downloaded to Mac or Windows devices. Developed by TC2000, the software provider combines charting, stock & options screening, plus easy-to-use trading features in a polished platform. Plot intrinsic value, time value and more.
An unlimited free trial is available although the features are basic. An annual subscription is £75 per month for the full range of services.
Bottom Line On Binary Options Charts
Binary options charts are an effective technical analysis tool that can inform trading decisions. The visualisation of complex pricing history can support forecasting efforts while also confirming investment theories. Remember, no binary options chart can guarantee profits and historical data is not always an accurate indicator of future price movement.
Use our list of leading binary options brokers with user-friendly charting tools to get started today.
FAQs
What Are Binary Options Charts?
Binary options charts combine historical price information and past trades to help predict future trends. They are used by traders to inform investment decisions.
Are Binary Options Charts Suitable For Beginners?
Charts and graphs can simplify complex data into clear visual aids. They can feel tricky to get your head around to start with, but charts can help beginners in their binary options trading journey. New investors may want to use a demo account to get familiar with charting tools before risking funds.
Is It Worth Trading Binary Options Without Charts?
It is possible to profit from binary options trading without using charts and graphs. Nonetheless, price charts and historical data can confirm investment theories and validate trading strategies.
Are Binary Options Charts Free To Use?
Several free charting software tools provide adequate visualisation of complex data. MT4, for example, is one of the most recognised free charting software providers. Many of the top binary options brokers also offer in-house platforms with beginner-friendly charts and graphs.
What Are The Main Binary Options Charts Available?
The main types of binary options charts are candlestick charts, line graphs and bar charts. The Japanese candlestick chart displays the most information, including the highest prices reached during the selected time frame.