The TRIX Multi-Time Frame Strategy
The principle behind multi time frame analysis is that if the trend on the a short term, medium term and long term chart all correspond with each other, then the trader should setup a trade position to follow that trend. This is the basis of the TRIX Multi-time frame strategy.
Top Brokers UK
This strategy gets its name from the customized indicator used in setting it up, the Trix Indicator. This strategy aims to use this indicator to try to see if a currency asset has the same trend on multiple time frames as a way of determining the future price direction of that currency asset. It can be implemented on any currency pair, and analysis is done using the 5-minute, 15-minute and hourly time frames.
The indicators used in this trade are as follows:
1) smSuper TRIX version1
2) MTF Trix Meter 1.1d
The original system makes use of just these two indicators, but a modification of this system includes the use of pivot points to serve as a means of adding an enhanced benchmark for taking trades. The pivot points can be plotted manually, but for simplicity, it is advocated to use an automatic Pivot point calculator to do this. Automatic pivot points are available for free from several online sources.
The Trix Custom Indicator
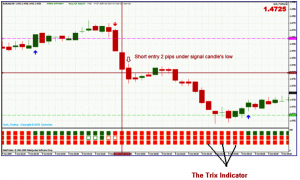
Let us give a background to the Trix indicator. It is a custom indicator which must be attached to the Experts à Indicator folder of the MT4 trading client. From there, the indicator can be attached to the charts. After attachment of this custom indicator to the charts, it appears as rows of three stacked blocks, with each block in a stack representing a Trix signal on the three timeframes. The boxes are colour coded, with green indicating a buy signal and red indicating a sell signal. Empty squares which appear white indicate periods at which the trend of the currency is indeterminate or when the currency pair is in consolidation (range-bound).
ENTRY RULES
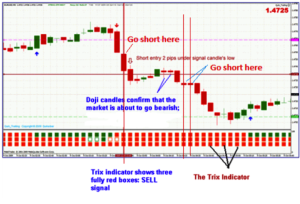
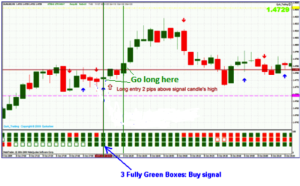
The 5-minute chart is used for the trade entry. A valid entry signal occurs when the Trix signal is identical on all three timeframes. This is visually depicted by the three squares of the Trix indicator all showing the same colour. Looking at the chart examples below, red signifies a bearish signal while green shows a bullish signal. Trade entries are made at about 5 pips below or above the signal candle’s low or high points respectively.
Short Entry Signal
The chart above shows two bearish signals at the level of the vertical cross line. The first is shown by the first red arrow on top, which is the indicator arrow that shows that the market has started to go bearish. However, the trade is not executed at this point as the Trix indicator is yet to confirm it (there are two red and one white squares and so signal is not yet valid). At the open of the next candle, the three Trix squares (shown by the vertical grid line) have now turned uniformly red, so the trader can now go short at this point, and set an acceptable profit target. The second point of short entry is at the level of the two bearish Doji candles which occur at another site where the three time frame squares of the Trix indicator are all red. The trader can place a short entry on completion of the 2nd Doji.
Long Entry Signal
The chart above shows a bullish entry trade setup. Here the three time frame squares of the Trix indicator have all turned green at the same time that a Doji has formed after a hammer. The hammer occurred at a point when there were two green squares and one red square for the Trix indicator, so this is not a valid entry point. It is only when the Trix has turned green uniformly that the entry could be made (shown by the vertical grid line). This leaves us with two possible long entry points as shown.
EXIT RULES
There are various exit criteria that could be used. Some of these are:
a) Support and resistance points, with a long entry timed to terminate at resistance and a short entry timed to terminate at support.
b) Use of reversal candlesticks, which indicate that the momentum is temporarily over.
Traders should bear in mind that since the trade entries are made with a very short term time frame, signals will occur repeatedly as long as the trend is maintained on the long term chart. So traders will always get opportunities to make multiple trades using the Trix indicator.


